Desert Online General Trading LLC
Dubai, United Arab Emirates
Desert Online General Trading LLC
Dubai, United Arab Emirates


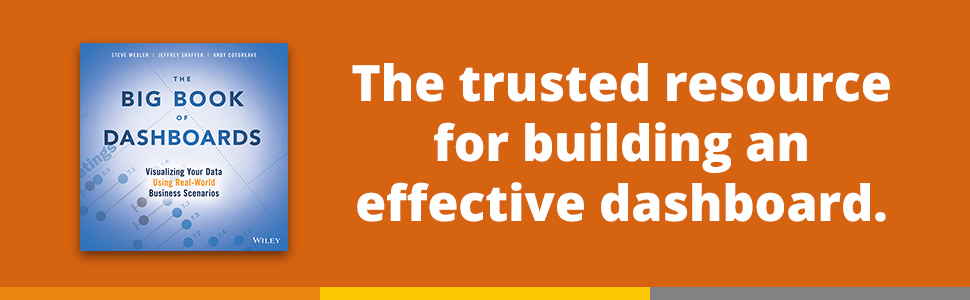
The Big Book of Dashboards: Visualizing Your Data Using Real-World Business Scenarios
A**R
an excellet resource for Tableau professionals
The Big Book of Dashboards has been an invaluable resource in my previous work as a Tableau consultant. The example dashboards were excellent tools for discussing prototypes with customers, helping to align on design and functionality early in the development process. Additionally, I’ve used the book to illustrate visual analytics best practices to Tableau creators I collaborate with, ensuring they build impactful and user-friendly dashboards. The combination of practical examples and expert guidance makes this book a great resource for Tableau professionals.
C**N
An outstanding and accessible book on visualising data
This is a special book.What sets it apart from its peers is that it manages to articulate the reasons why things work, but does so in a way that is more accessible and far less pretentious than many alternatives. I actually own and enjoyed a number of those other options, but this book has an inherent readability and the image / text ratio is much better balanced than a number of the options in the market.In addition, it is a "new" book. It contains a number of examples of modern, effective designs, whereas many other books in this field are becoming a little dated and so perhaps omit some of the more contemporary innovations in data visualisation, which remains an evolving discipline. The examples are of good visualisations, rather than bad, and this focus means that the reader is exposed to a vast range of quality content, rather than endless examples of what "not to do".Overall, it's highly recommended. It covers design theory in a way which is informative, applicable and concise, but crucially devotes a lot of paper to examples which you can immediately begin to imagine implementing in your personal and professional data visualisation projects.
R**W
Great book, but arrived damaged
Great book for improving dashboarding skills w.r.t. data visualisation.Not happy, though, about a new book from Amazon arriving in the condition it did (see photo).
H**N
A Good book
A thick one but lots of figures with short explanation and comments from the authors. Recommend it!
A**Z
You need to read this book if you're working with data visualization
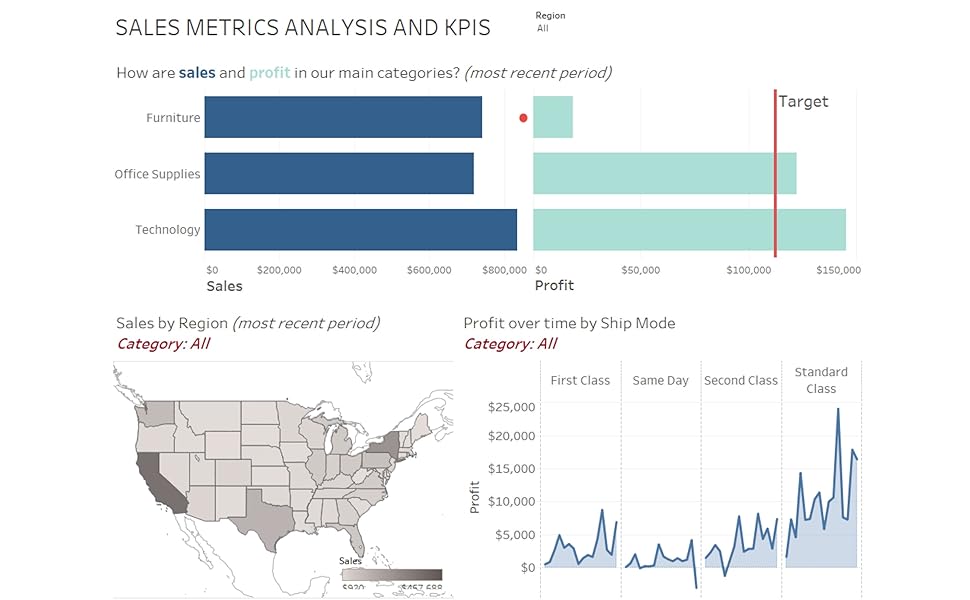
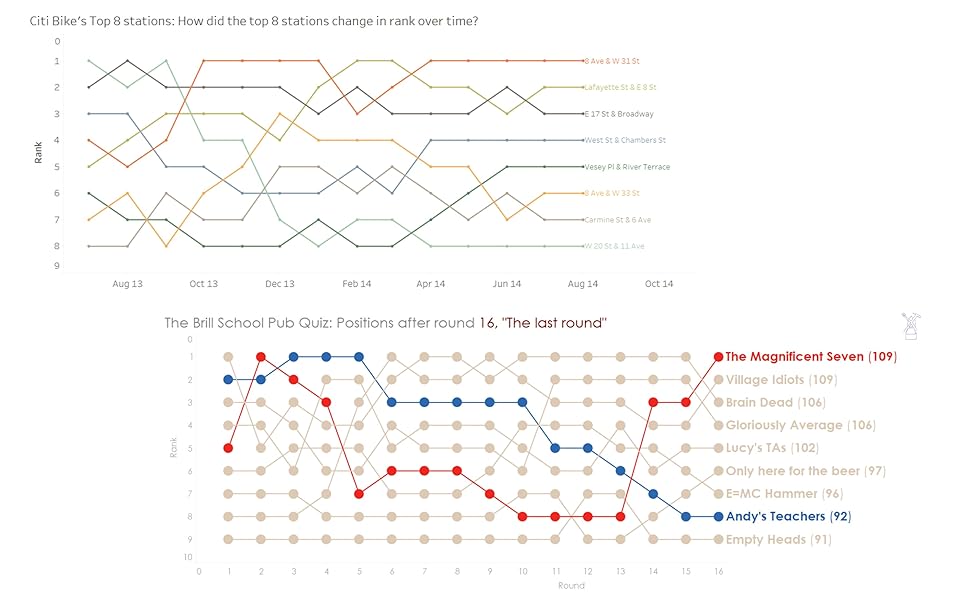
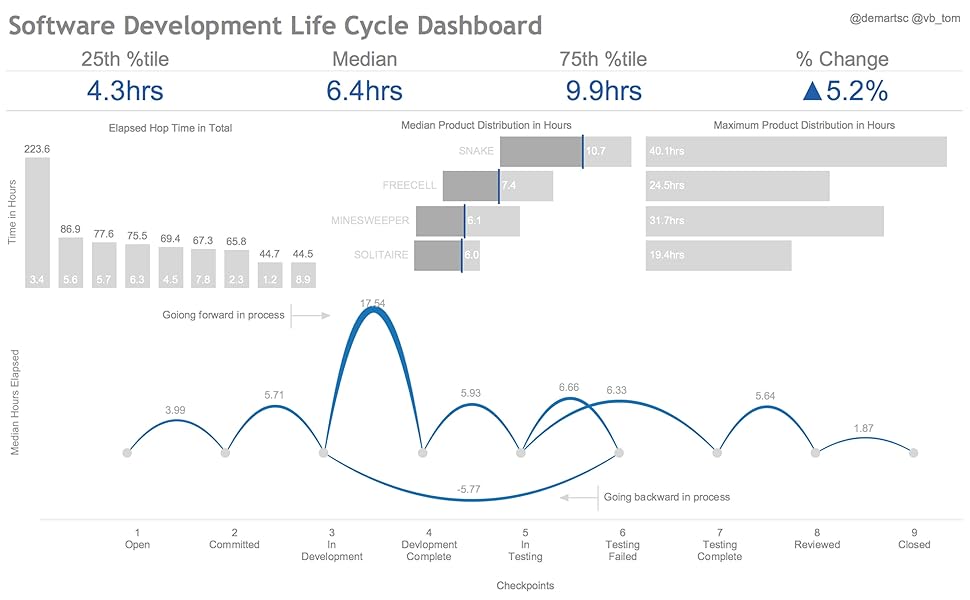
Once you have read the book you will want to keep it nearby to use as a guide for your data visualization projects. In the book you'll find 20+ high quality dashboards based on all kids of data from different industries with detailed explanation why certain chart types, layout, colors have been used, why what have been used works well, why other choices were not good enough and what could be changed to make the dashboard even better.
M**M
Lots of data, but does not come to life for me
I think perhaps you need a background in psychology or marketing to appreciate this book. It starts with a "primer" on dashboards, but it didn't seem at all intuitive to me, so I think it must be assuming a basic level of specialist knowledge.The bulk of the book (pages 38-337) are examples of different types of dashboards. And while there is a huge amount of data here, I think I realised at this point that, because I expect dashboards to be interactive, a print format is probably not the best (at least, not for me). A web-based version would allow some of the interactivity they are trying to illustrate.Overall, the example dashboards didn't come to life for me, and I think it was due to the lack of interactivity (unavoidable obviously in a print book)
I**M
Good book for practioners.
Effective and befficient insight into what it should all look like. Good read with speedy and punchy insights. Tableu focus is a plus.
A**H
Well written and presented but resources mostly for Tableau
I really really liked this book but I felt quite frustrated that the file examples given were (with one or two exceptions) all Tableau based. Lots of great examples and case studies but for me the lack of files in Excel (with one or two exceptions) was a disappointment.
Trustpilot
Hace 1 semana
Hace 1 semana